Bitcoin is struggling to gain bullish momentum above $11,300 against the US Dollar. BTC could extend its decline unless it surges past the 100 hourly SMA.
- Bitcoin is facing a strong resistance near the $11,300 and $11,400 levels.
- The price is now trading well below the $11,400 level and the 100 hourly simple moving average.
- There is a short-term declining channel forming with resistance near $11,230 on the hourly chart of the BTC/USD pair (data feed from Kraken).
- The pair is likely to remain well bid near the $11,000 and $10,840 levels in the near term.
Bitcoin Price is Facing Hurdles
In the past few sessions, bitcoin price struggled to gain bullish momentum above the $11,300 and $11,400 levels against the US Dollar. The last swing high was near $11,374 before BTC started a steady decline.
It traded below the $11,200 level and settled well below the 100 hourly simple moving average. The recent low was near $11,035 and the price is currently correcting higher. It surpassed the 23.6% Fib retracement level of the recent decline from the $11,374 high to $11,035 swing low.
The price is currently facing hurdles near the $11,200 level. There is a short-term declining channel forming with resistance near $11,230 on the hourly chart of the BTC/USD pair.
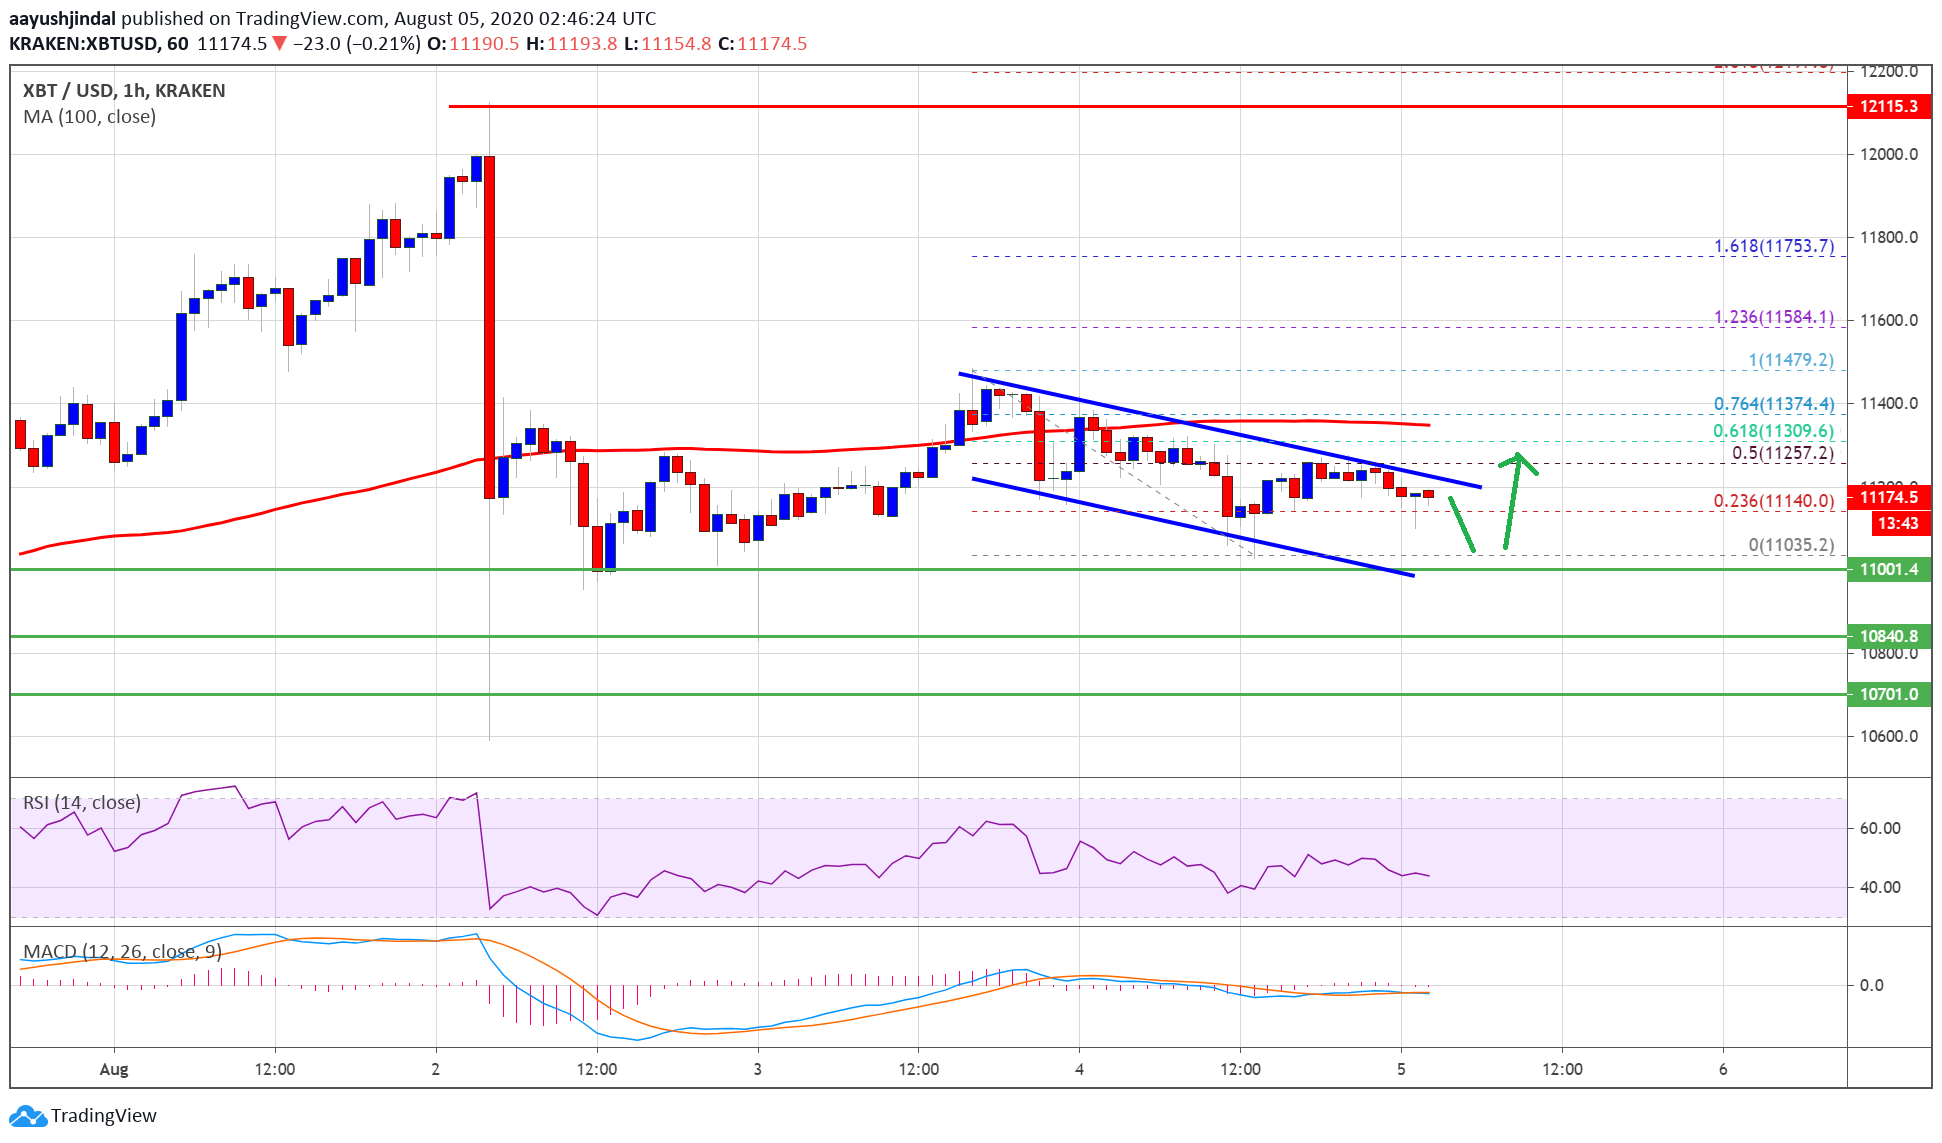
Bitcoin price trades above $11,200. Source: TradingView.com
Above the channel resistance, the $11,250 is a key hurdle. The 50% Fib retracement level of the recent decline from the $11,374 high to $11,035 swing low is also near the $11,250 level to act as a hurdle. The main hurdle is still near the $11,350 and $11,400 levels.
A successful close above the $11,400 level is needed for a fresh increase since it is close to the 100 hourly simple moving average. In the mentioned case, the price could rally towards the $11,600 and $11,800 levels.
Downside Break in BTC?
If bitcoin fails to clear the channel resistance or the 100 hourly SMA, there is a risk of a sharp decline below the $11,000 support level.
A clear break below the $11,000 support level could lead the price towards the $10,850 support zone. The next major support is near the $10,550 level, where the bulls are likely to take a stand.
Technical indicators:
Hourly MACD – The MACD is slowly moving into the bullish zone.
Hourly RSI (Relative Strength Index) – The RSI for BTC/USD is currently rising towards the 50 level.
Major Support Levels – $11,000, followed by $10,850.
Major Resistance Levels – $11,250, $11,350 and $11,400.
Source link


No comments:
Post a Comment