Ripple is still trading above the $0.1920 support zone against the US Dollar. XRP price seems to be following a bullish flag pattern and it could rally above $0.2100.
- Ripple price is showing positive signs above the $0.1920 and $0.1900 support levels against the US dollar.
- The price is trading near the $0.2000 resistance, but it is above the 100 simple moving average (4-hours).
- There is a crucial bullish flag forming with resistance near $0.2000 on the 4-hours chart of the XRP/USD pair (data source from Kraken).
- The pair is likely to start a fresh rally once it clears the $0.2000 and $0.2030 resistance levels.
Ripple Price Eyeing Upside Break
In the past few days, ripple’s XRP started a downside correction from the $0.2118 swing high. It corrected below the $0.2050 and $0.2020 support levels. The price even spiked below $0.1900, but downsides were limited.
During the decline, there was a break below the 50% Fib retracement level of the upward surge from the $0.1741 low to $0.2118 swing high. The bulls were able to save the $0.1890 support zone and the 100 simple moving average (4-hours).
Moreover, the 61.8% Fib retracement level of the upward surge from the $0.1741 low to $0.2118 swing high also acted as a strong. The price is now rising and it is trading above the $0.1920 level.
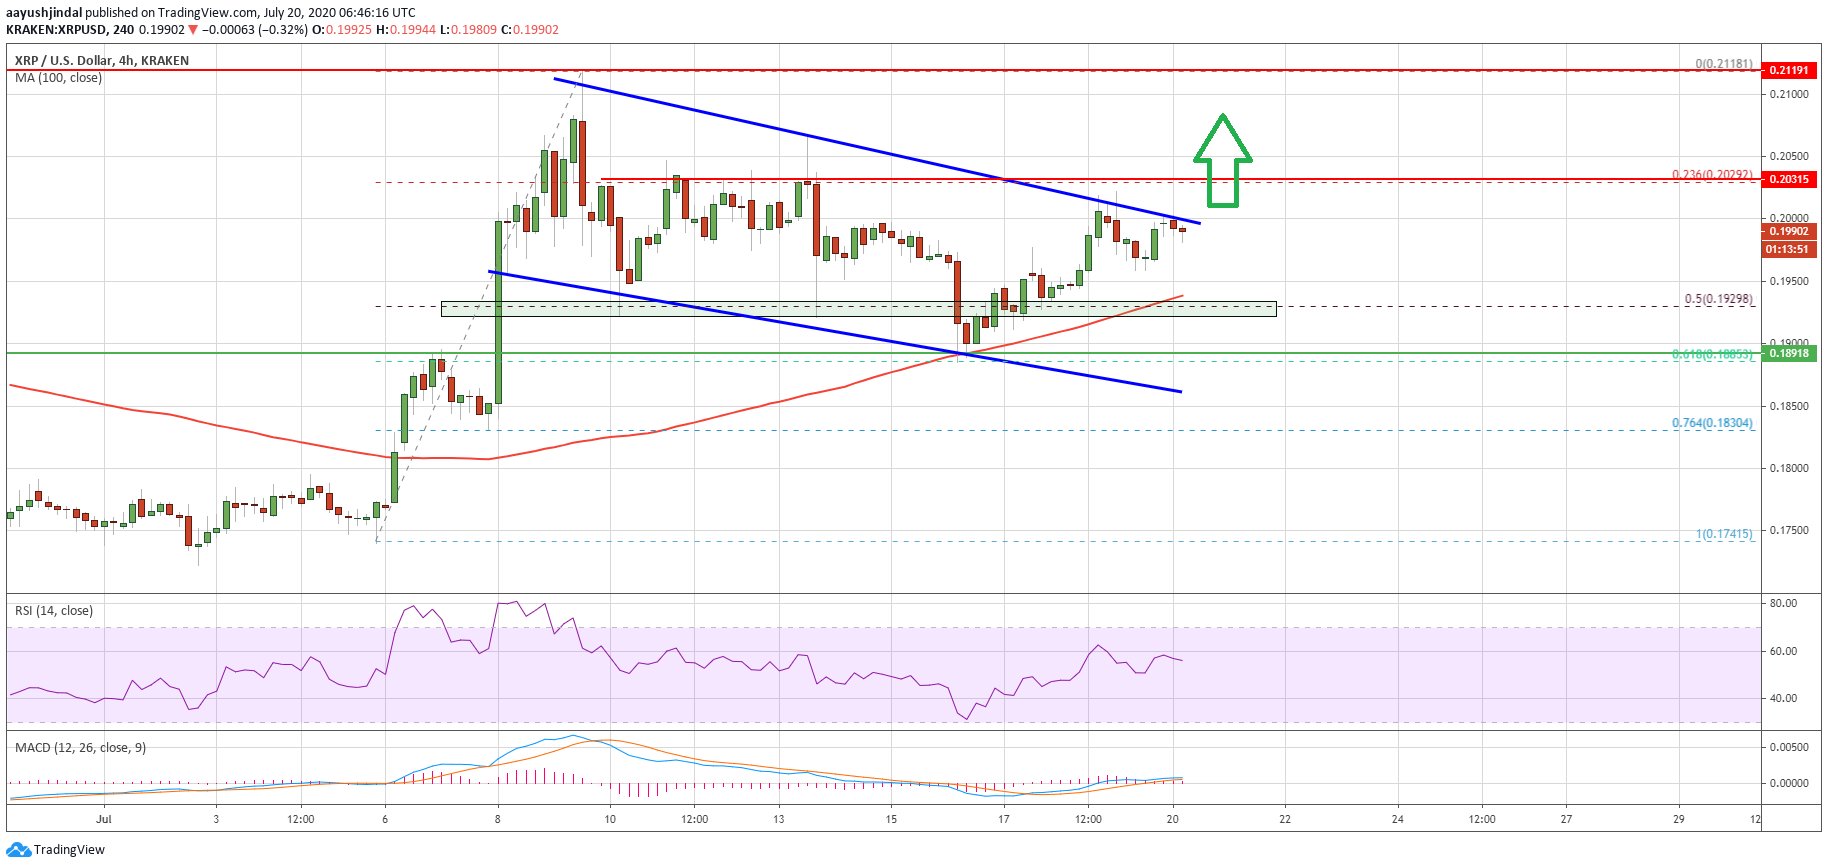
Ripple (XRP) price testing $0.2000. Source: TradingView.com
The current price action is positive and the price is trading above the 100 simple moving average (4-hours) ($0.1945). There is also a crucial bullish flag forming with resistance near $0.2000 on the 4-hours chart of the XRP/USD pair.
The pair must break the bullish flag resistance at $0.2000 to start a fresh increase. The next major resistance is near the $0.2030 level, above which there are chances of a steady rise towards the $0.2120 level.
Downside Break in XRP
Conversely, the price might correct lower towards the $0.1945 and $0.1920 support levels. The main support is near the $0.1900 level.
If there is a daily close below the $0.1900 support zone, the price could continue to move down towards the $0.1820 and $0.1800 support levels.
Technical Indicators
4-Hours MACD – The MACD for XRP/USD is now gaining strength in the bullish zone.
4-Hours RSI (Relative Strength Index) – The RSI for XRP/USD is currently correcting lower towards the 50 level.
Major Support Levels – $0.1945, $0.1920 and $0.1900.
Major Resistance Levels – $0.2000, $0.2030 and $0.2120.
Take advantage of the trading opportunities with Plus500
Risk disclaimer: 76.4% of retail CFD accounts lose money.
Source link

No comments:
Post a Comment